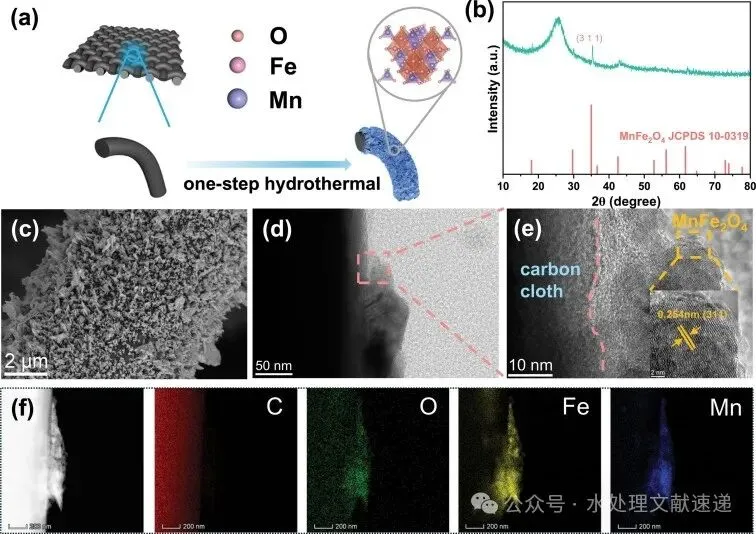
Fig. 1. a) Synthesis scheme, b) XRD pattern, c) SEM and d, e) HRTEM images, and f) element mapping of MnFe2O4/CC.
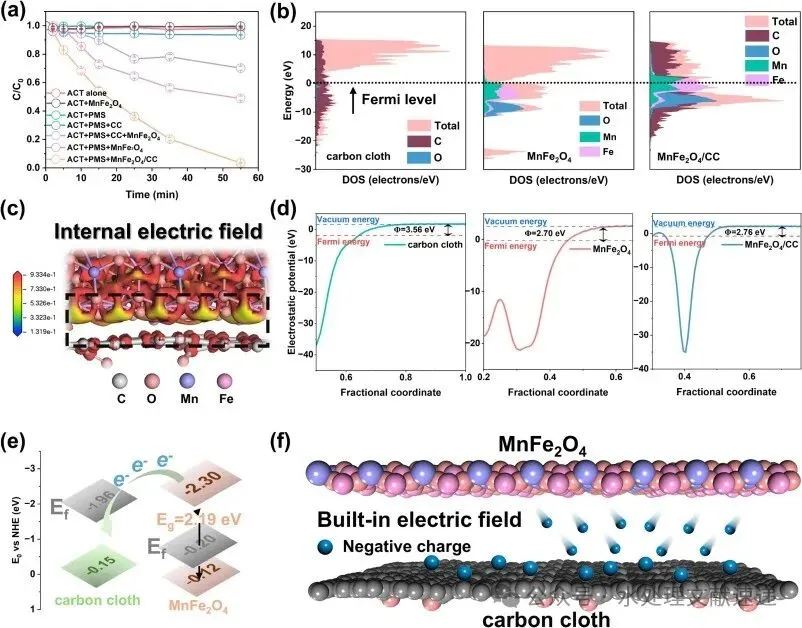
Fig. 2. a) ACT degradation curves in different systems (Conditions: [ACT] = 0.01 g/L, [catalyst] = 0.1 g/L, [PMS] = 0.3 mM, T = 30 °C); b) PDOS of CC, MnFe2O4 and MnFe2O4/CC; c) charge difference distribution at the interface of MnFe2O4/CC, red and yellow indicate charge accumulation and depletion; d) work function of CC, MnFe2O4 and MnFe2O4/CC; e) schematic of electron transfer driven by energy band differences; f) schematic of electron transfer in BIEF. (For interpretation of the references to colour in this figure legend, the reader is referred to the web version of this article.)
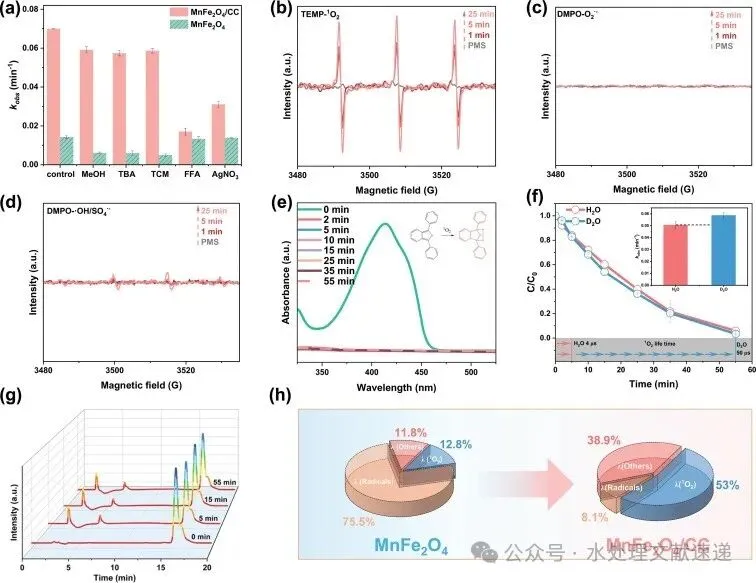
Fig. 3. a) Effects of quenchers on kobs of ACT degradation; b-d) EPR spectra for DMPO−SO4∙-/∙OH, DMPO − O2∙-and TEMP−1O2; e) UV–Vis absorption spectra of DPBF in the MnFe2O4/CC/PMS system (Conditions: [DPBF] = 30 µM, [catalyst] = 0.1 g/L, [PMS] = 0.3 mM, T = 30 °C); f) ACT degradation in D2O and H2O solution by MnFe2O4/CC/PMS system (Conditions: [ACT] = 0.01 g/L, [catalyst] = 0.1 g/L, [PMS] = 0.3 mM, T = 30 °C); g) HPLC curves of typical products generated by the oxidation of FFA in MnFe2O4/CC/PMS system (Conditions: [FFA] = 5 mM, [catalyst] = 0.1 g/L, [PMS] = 0.3 mM, T = 30 °C); h) contribution for ACT degradation by different pathways.
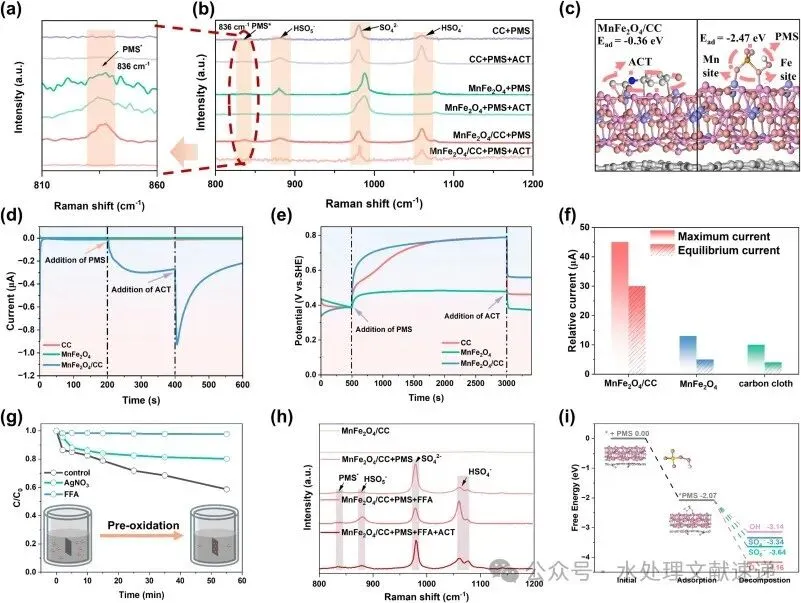
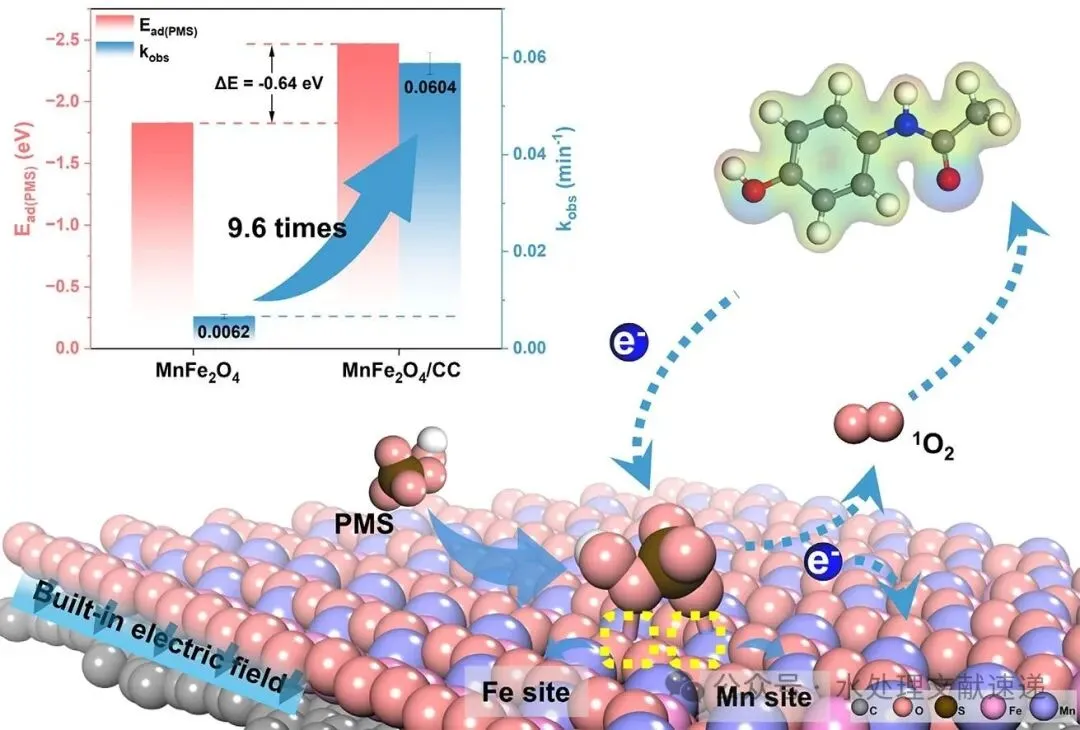
Fig. 4. a, b) In situ Raman spectra; c) DFT calculation of adsorption energies of ACT and PMS on MnFe2 O4/CC; d) i-t curves, and e) OCP curves of CC, MnFe2O4 and MnFe2O4/CC; f) currents of the MnFe2O4/CC, MnFe2 O4, and CC-based GOS systems after adding ACT; g) ACT degradation curves by pre-oxidized catalysts in the presence of quenchers (Conditions: [ACT] = 0.01 g/L, [catalyst] = 0.1 g/L, [quencher] = 5 mM, T = 30 °C); h) in situ Raman spectra after FFA injection; i) Gibbs free energies of PMS* decomposition on the surface of MnFe2O4/CC.
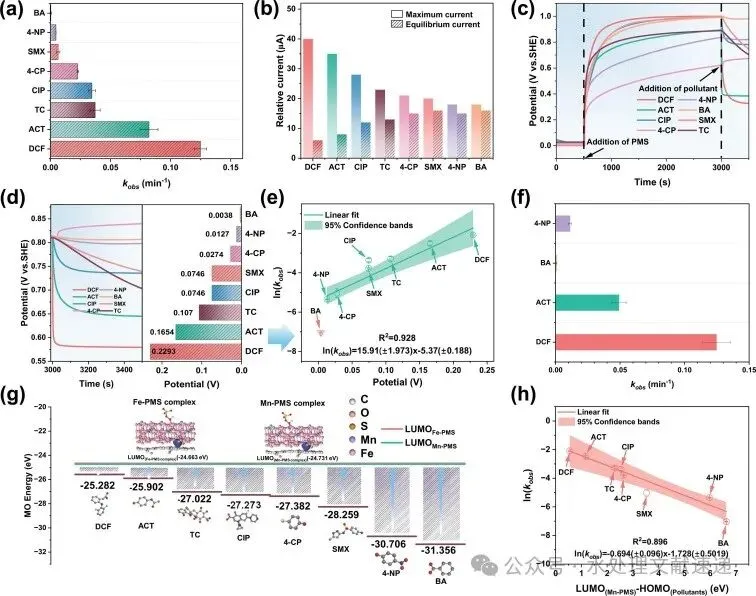
Fig. 5. a) kobs values of different pollutants degradation in the MnFe2O4/CC/PMS system; b) currents after adding different pollutants in the MnFe2O4/CC-based GOS system; c) OCP curves and d) falling potentials of the MnFe2O4/CC electrode; e) correlation between the ln(kobs) and the falling potentials; f) kobs in the coexistence of multi-pollutants; g) energy gaps between LUMO of PMS* and HOMO of pollutants; h) correction between the calculated gaps and ln(kobs) of pollutants. Conditions: [pollutant] = 0.01 g/L, [catalyst] = 0.1 g/L, [PMS] = 0.3 mM, T = 30 °C.
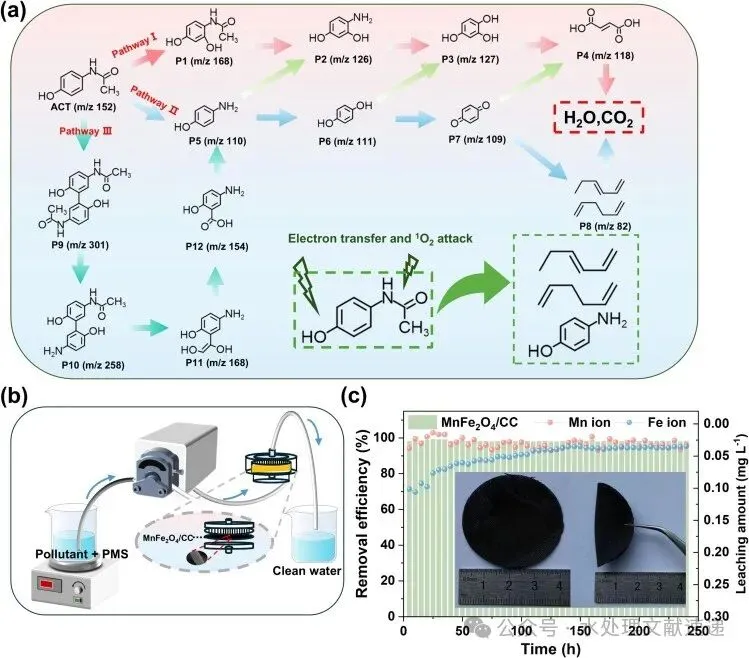
Fig. 6. a) Possible degradation pathways of ACT in the MnFe2O4/CC/PMS system; b) schematic diagram of continuous oxidation system; c) metal ion leaching and degradation efficiency of ACT by the MnFe2O4/CC/PMS continuous oxidation system. Conditions: [ACT] = 0.01 g/L, [catalyst] = 0.1 g/L, [PMS] = 0.3 mM, flow rate = 1 mL min−1 ; temperature = 30 °C.


 10个月宝宝每天需要喝多少奶粉?
