南昌大学 | 中国农牧系统的氮困境:基于利用效率与污染热点视角评估减缓潜力并探索优化路径
- 2026-07-11 02:10:33
中国农牧系统的氮困境:基于利用效率与污染热点视角评估减缓潜力并探索优化路径
TWu, Z., Liang, H., Liu, Z., Du, H., He, L., Xie, Z., Zhu, J., Zheng, B., Wan, W., 2026. Nitrogen dilemma in Chinese crop-livestock systems: assessing mitigation potential and exploring optimization pathways from the perspectives of utilization efficiency and pollution hotspots. Agricultural Systems.233,104642. https://doi.org/10.1016/j.agsy.2026.104642.
研究速览:本研究改进了食物链、环境与资源利用的养分流(NUFER)模型,创新性地引入人粪尿指标与畜牧本地化参数,构建了市域尺度的综合分析框架。旨在量化氮流、揭示氮利用效率的演变、识别氮流失热点区域,并评估区域差异化氮管理的减排潜力与优化路径
摘要 | Abstract
背景:中国农牧系统因化肥过量使用和粪便管理不善,已成为农业氮(N)污染的主要来源。目前,中国市域尺度农牧系统的氮素流动特征、氮利用效率演变及环境损失热点仍缺乏系统性研究,尤其不同作物与畜禽氮损失的相对贡献尚不明确;且现有畜牧业氮流评估因忽视养殖结构、自然地理条件和饲养管理的空间异质性对结果造成较大偏差。
方法:改进了食物链、环境与资源利用的养分流(NUFER)模型,创新性地引入人粪尿指标与畜牧本地化参数,构建了市域尺度的综合分析框架。
结果与结论:结果表明:农牧系统养分利用效率显著提升。2000年至2022年间,农田系统、畜牧系统及农牧系统的氮利用效率相较于2000年水平分别相对提高了39.91%、46.30%和43.47%,且呈现出明显的空间差异。农田系统氮利用效率高值区(> 50%)主要集中在东北平原和黄淮海平原区,而畜牧系统氮利用效率低值区(< 15%)则主要分布在中国西部及云贵高原区。值得注意的是,水果和蔬菜(经济作物)的氮利用效率显著低于粮食作物。玉米、蔬菜、水稻、水果和小麦贡献了农田氮流失总量的82.29%,而肉牛、生猪和蛋禽则占畜牧氮流失的83.52%。其中,水果和奶牛表现出最高的氮流失强度,分别为110.07 kg·ha⁻1和31.72 kg·lu⁻1。在大部分区域,氨挥发是主要流失形式,而在四川盆地及周边地区与云贵高原区,径流和侵蚀则占主导。我们识别出集中的热点区域——仅占中国陆地面积的6.17%,却贡献了全国氮流失总量的30.42%——主要分布于:
(1)黄淮海平原中南部;
(2)长江中下游地区北部;
(3)四川盆地及周边地区中部、黄土高原及云贵高原区。情景分析表明存在显著的减排潜力。综合措施(推荐施肥、农业资源循环利用、畜牧养殖结构优化及粪便管理)可减少22.64%的矿物氮肥投入,同时氮流失降低5.03 Tg(31.38%)
意义:本研究为中国乃至全球其他国家的农业系统实施空间差异化的氮管理策略提供了科学依据。
亮点 | Highlights
中国农牧系统氮利用效率明显提高;
不同作物和畜禽生产中氮损失的相对贡献被量化;
中国农牧系统不同途径氮损失的热点地区被揭示;
不同情景措施下农牧系统氮损失消减潜力被定量化;
探索了区域差异化的氮素管理优化路径。
NUE in Chinese crop-livestock systems has improved significantly
Relative contributions of N losses in different crops and livestock production were quantified
Hotspots of N loss by different pathways in Chinese crop-livestock systems were revealed
The N loss mitigation potential of crop-livestock systems under different scenario measures was quantified
Optimized pathways for regional differentiation in N management were explored
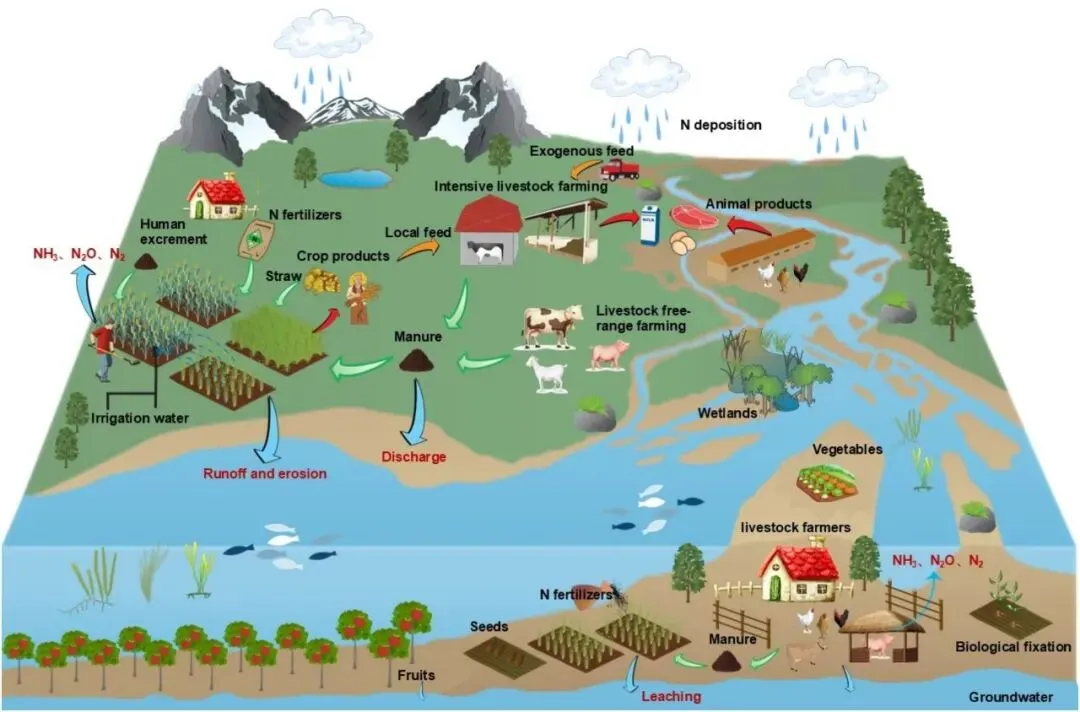
图 1. 农牧系统边界示意图。注:绿色箭头代表养分输入;蓝色箭头代表养分损失;红色箭头代表主要产品输出;黄色箭头代表内循环过程;红色字体代表不同的氮素流失途径。
Fig. 1.Diagram of crop-livestock system boundary. Note: Green arrows represent nutrient inputs; blue arrows represent nutrient losses; red arrows represent main product outputs; yellow arrows represent endocycling processes; and red lettering represents different N loss pathways.
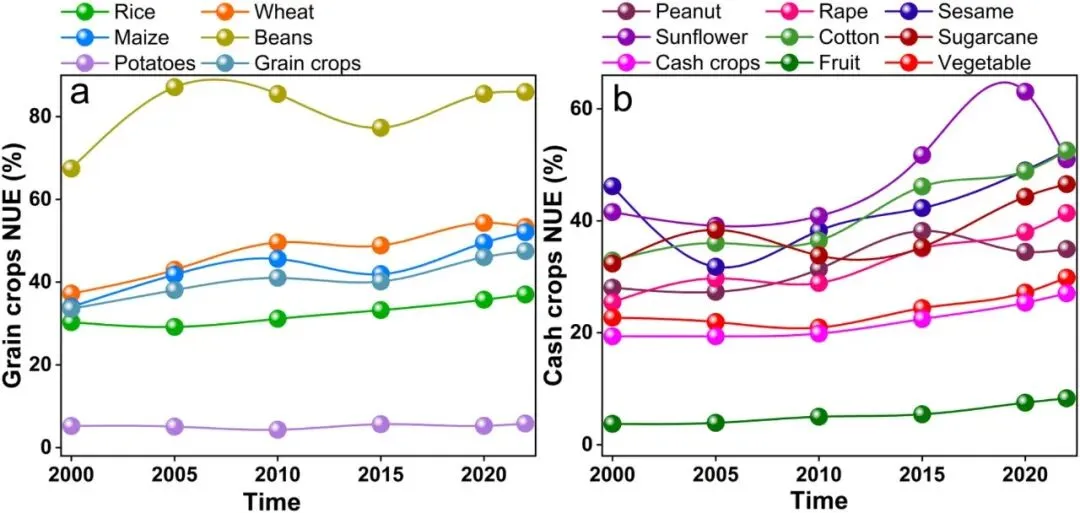
图 2. 不同作物氮利用效率的变化。a,粮食作物;b,经济作物。
Fig. 2.Variation in NUE of different crops. a, Grain crops; b, Cash crops.
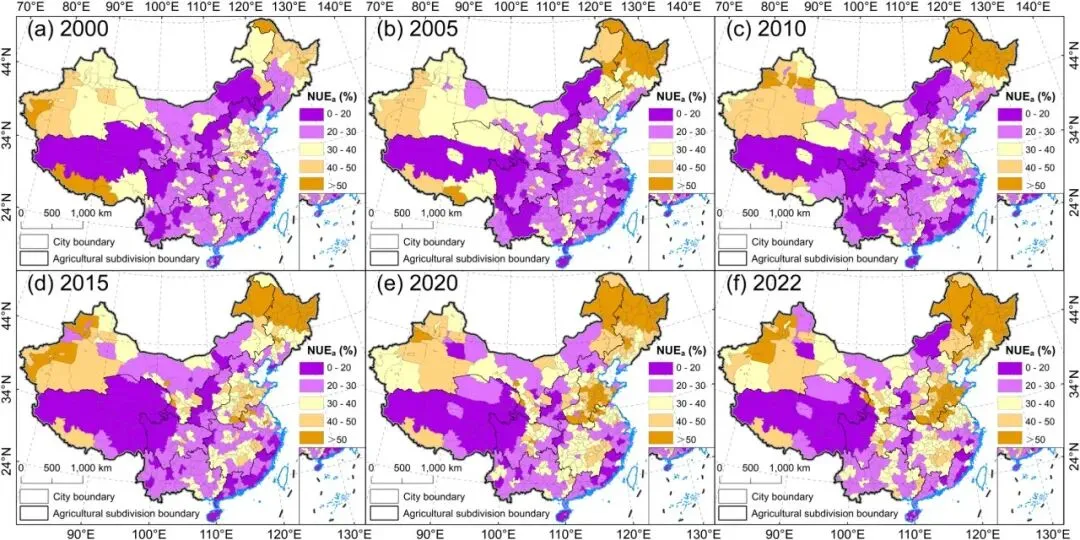
图 3. 中国农田系统氮利用效率空间分布。
Fig. 3.Spatial distribution of NUE of crop systems in China.
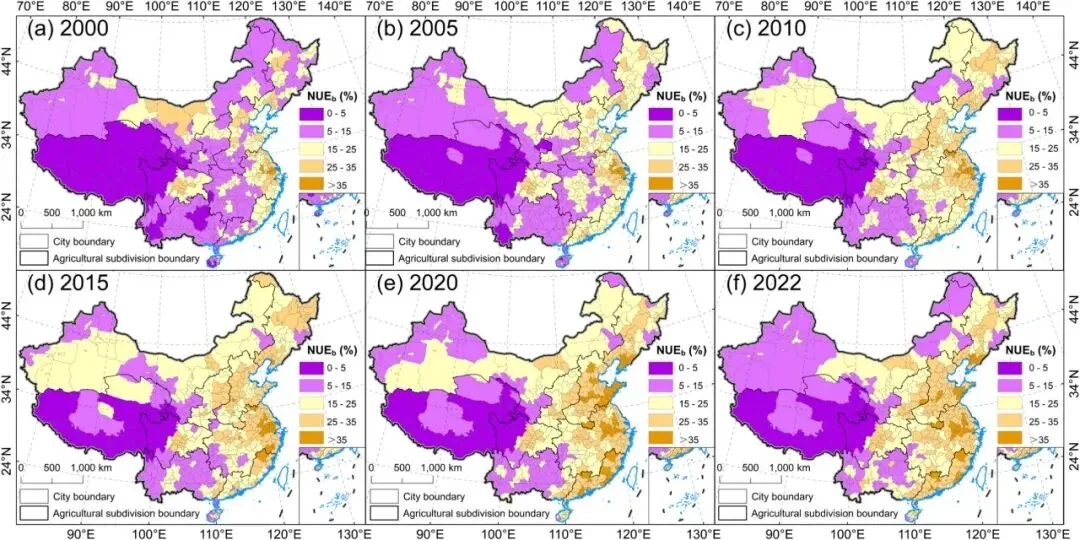
图 4. 中国畜牧系统氮利用效率空间分布。
Fig. 4.Spatial distribution of NUE of livestock systems in China.
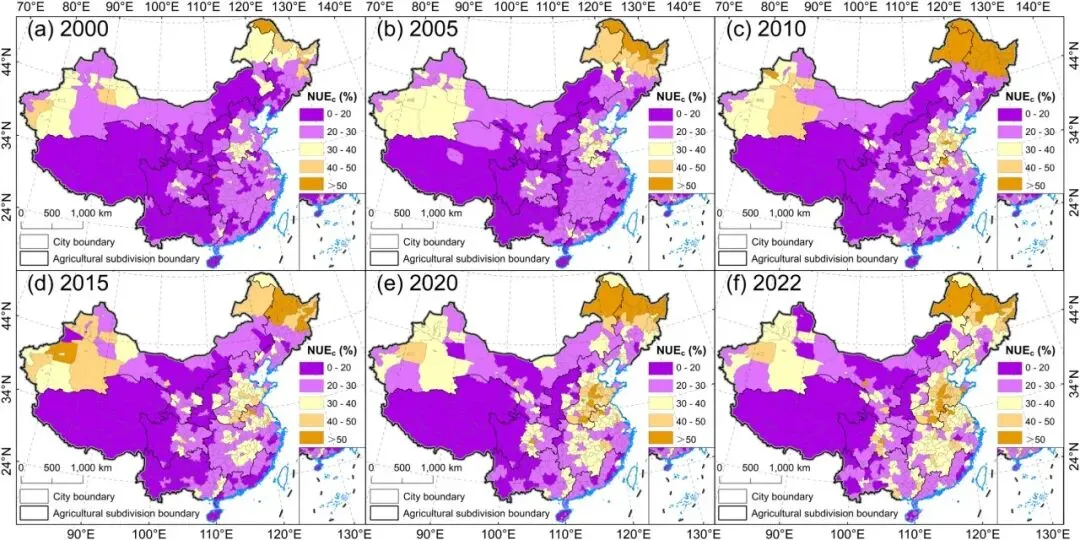
图 5. 中国农牧系统氮利用效率空间分布。
Fig. 5.Spatial distribution of NUE of crop-livestock systems in China.
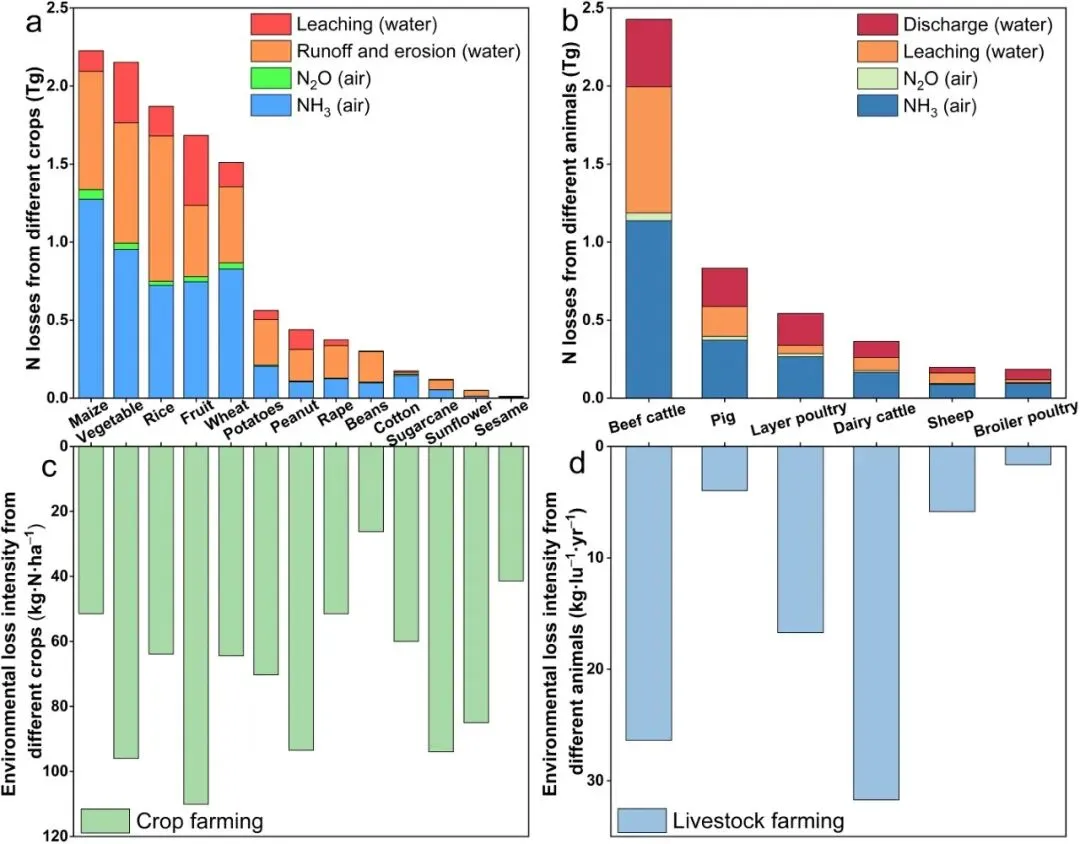
图 6. 2022年中国不同作物与畜禽的氮流失量及环境损失强度。a,不同作物的氮素流失量;b,不同畜禽的氮素流失量;c,不同作物的环境损失强度;d,不同畜禽的环境损失强度。注:水果类别汇总了多种具体水果类型(如苹果、柑橘、梨、瓜类)的数据。具体作物参数详见补充表S5;LU,牲畜单位。
Fig. 6.N losses and environmental loss intensity of different crops and livestock in China in 2022. a, N loss of different crops; b, N loss of different livestock; c, Environmental loss intensity of different crops; d, Environmental loss intensity of different livestock. Notes: The “Fruit” category aggregates data from multiple specific fruit types (e.g., apple, mandarin, pear, melons). See Supplementary Table S5 for detailed crop-specific parameters; LU, livestock units.
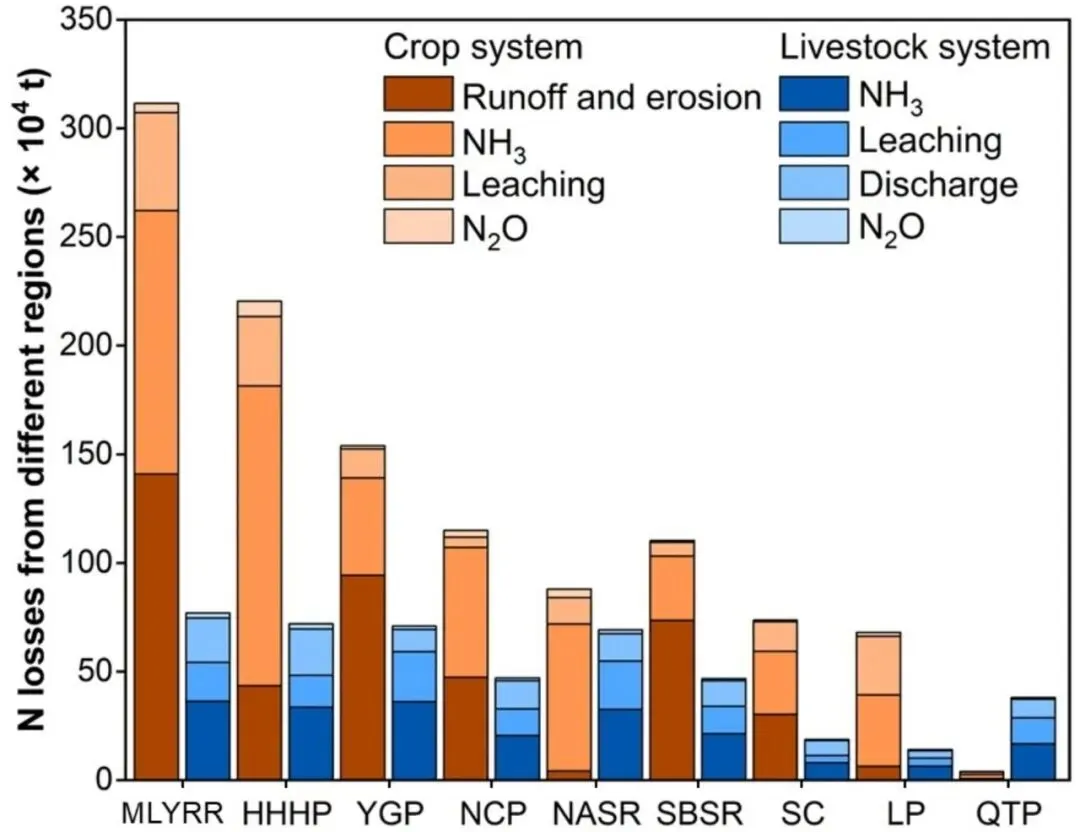
图 7. 2022年不同地区氮损失。
Fig. 7. N loss in different regions in 2022.
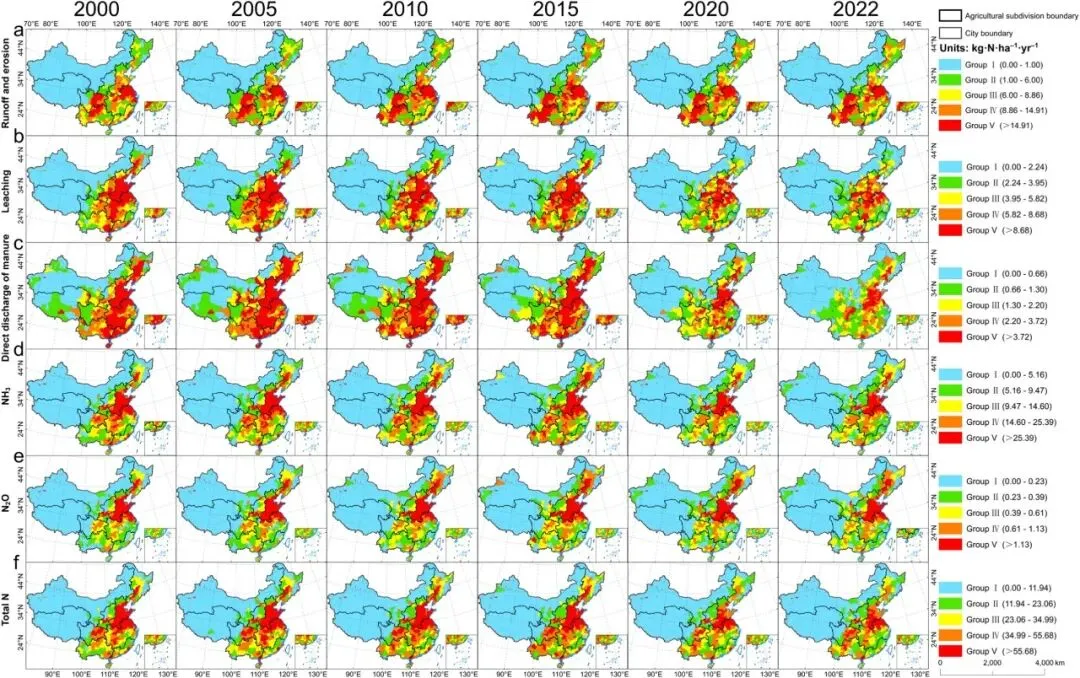
图 8. 2000—2022年中国农牧系统氮损失空间分布特征及热点分析。a, 2000—2022年农牧系统氮径流和侵蚀损失强度;b, 2000—2022年农牧系统氮淋溶损失强度;c, 2000—2022年农牧系统氮粪污直排到水体损失强度;d, 2000—2022年农牧系统NH3损失强度;e, 2000—2022年农牧系统N2O损失强度;f, 2000—2022年农牧系统总氮损失强度。以2022年数据为基准,Group Ⅰ为0%—20%,Group Ⅱ为20%—40%,Group Ⅲ为40%—60%,Group Ⅳ为60%—80%,Group Ⅴ为80%—100%。其中Group Ⅴ部分定义为环境损失热点地区,其他为非热点地区
Fig. 8. Characteristics of spatial distribution of N losses and analysis of hotspots in China's crop-livestock systems, 2000—2022. a, Intensity of N runoff and erosion losses; b, Intensity of N leaching losses; c, Intensity of N direct discharge of manure; d, NH3 loss intensity; e, N2O loss intensity; and f, total N loss intensity. Based on 2022 data, Group Ⅰ is 0–20%, Group Ⅱ is 20%–40%, Group Ⅲ is 40%–60%, Group Ⅳ is 60%–80%, and Group Ⅴ is 80%–100%. Among them, Group Ⅴ is partially defined as environmental loss hotspots, and the others are non-hotspots.
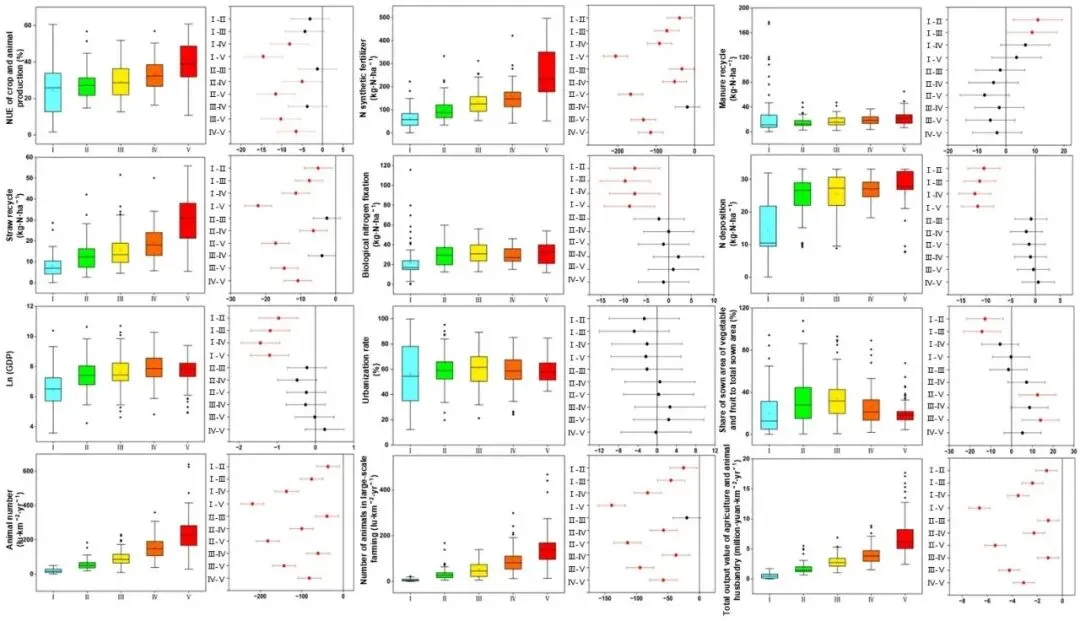
图 9.不同区域农业氮管理指标对比及组间差异显著性分析。以2022年五组总氮损失(图8)为基准,其不同城市的氮相关指标箱线图:农牧系统氮利用效率、合成氮肥施用量、粪肥循环强度、秸秆循环强度、生物固氮强度、氮沉降强度、GDP、城镇化率、蔬菜和水果播种面积占总播种面积的比例、畜禽数量、规模化养殖数量、农业和牧业总产值。箱线图右侧为Tukey’s HSD分析结果,判定不同组别数据是否存在显著性差异,红色代表为显著性差异,黑色代表无显著性差异.
Fig. 9. Five groups of total N losses in 2022 (Fig. 8) as a baseline. The box line plots of N-related indicators for different cities are as follows: NUEc, N synthetic fertilizer application, manure cycle intensity, straw cycle intensity, biological N fixation, N deposition, GDP, urbanization rate, ratio of vegetable and fruit sown area to total sown area, number of livestock, number of large-scale farming, and total value of crop-livestock production. Notes: the right side of the box line plots shows Tukey's HSD analysis results to determine whether there is a significant difference in the data of different groups, with red representing a significant difference and black representing no significant difference.
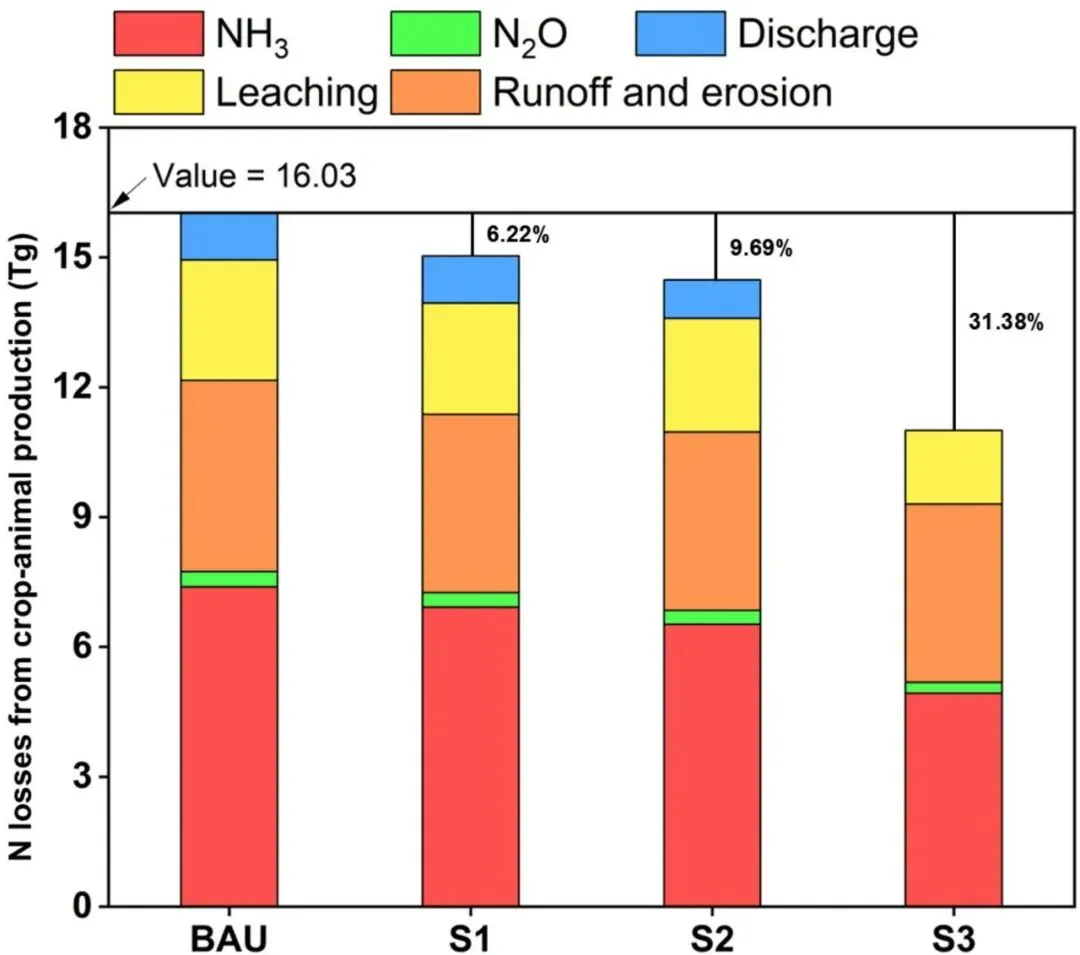
图 10.中国农牧系统情景模拟结果。
Fig. 10.cenario simulation results for China's crop-livestock systems.
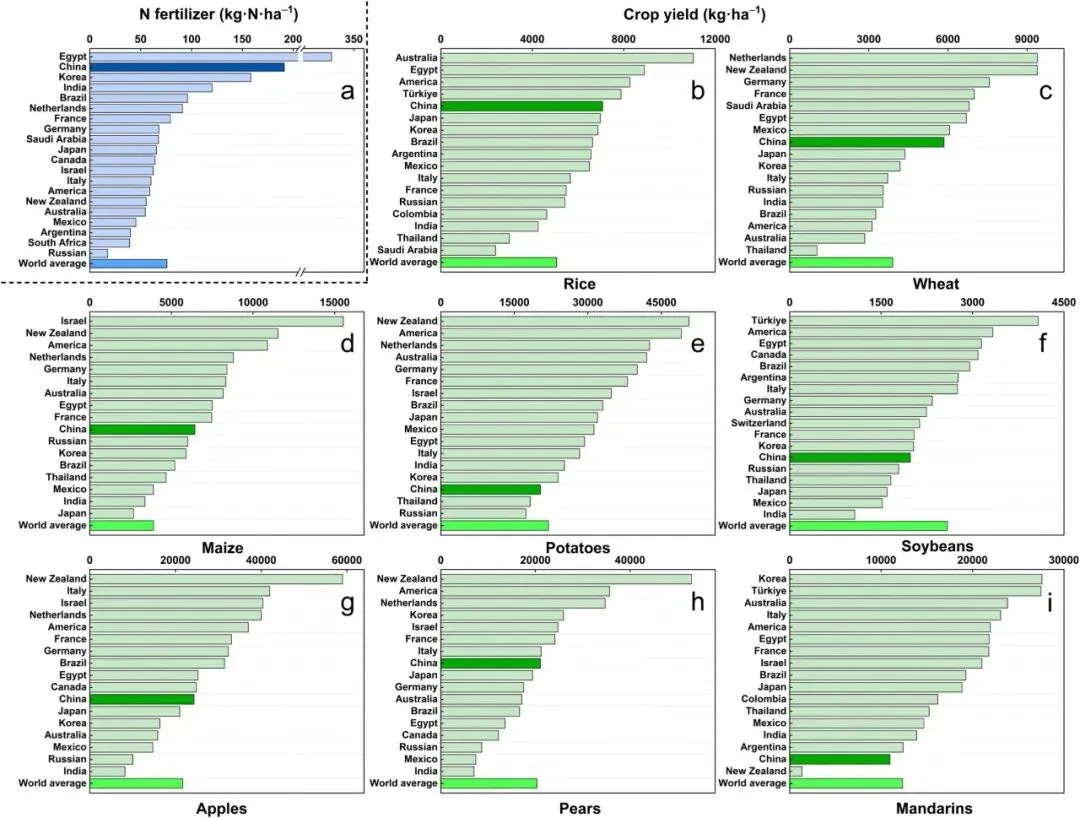
图 11.2022年,中国与其他国家化肥施用强度和不同作物单位面积产量对比。a)中国与其他国家化肥施用强度对比;b–i)中国单位面积水稻、小麦、玉米、薯类、豆类、苹果、梨和柑橘产量与部分国家对比。
Fig. 11.Comparison of N fertilizer application intensity and yields per unit area of different crops between China and other countries in 2022. a, Comparison of N fertilizer application intensity between China and other countries; b–i, Comparison of China's yields per unit area of rice, wheat, maize, potatoes, soybeans, apples, pears, and mandarins with other countries.
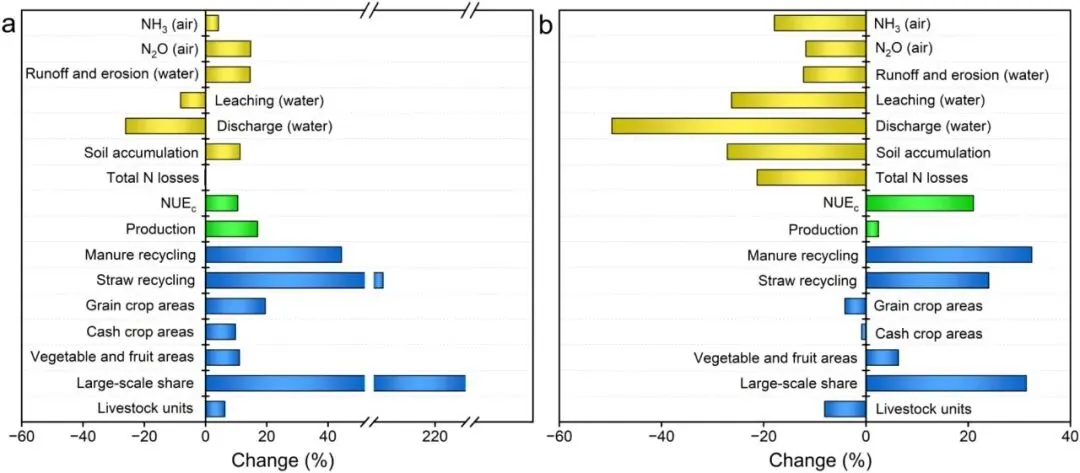
图 12.2000—2022年中国农牧系统绩效变化。a, 2000—2015年;b, 2015—2022年。注:畜牧业标准化养殖数量(以奶牛为标准单位)。黄色代表不同途径氮损失变化率;绿色代表农牧系统主产品氮和氮利用效率变化率;蓝色代表农业资源循环效率、粮食作物和经济作物播种面积、蔬菜和水果播种面积、畜禽养殖数量和规模化养殖数量变化率。
Fig. 12.Changes in the performance of China's crop-livestock systems, 2000–2022. a, 2000–2015; b, 2015–2022. Notes: “Production” refers to the total amount of N in crop and animal main products; “Livestock units” refers to the number of standardized livestock farms (in standard units of dairy cattle); “Large-scale share” refers to the number of large-scale livestock farms. Yellow represents the rate of change in N loss by different pathways; Green represents the rate of change in NUEc and the main products of the crop-livestock systems; and blue represents the rate of change in the efficiency of agricultural resource recycling, the sown area of grain crops and cash crops, the sown area of vegetables and fruits, the number of livestock farms, and the number of large-scale shares.
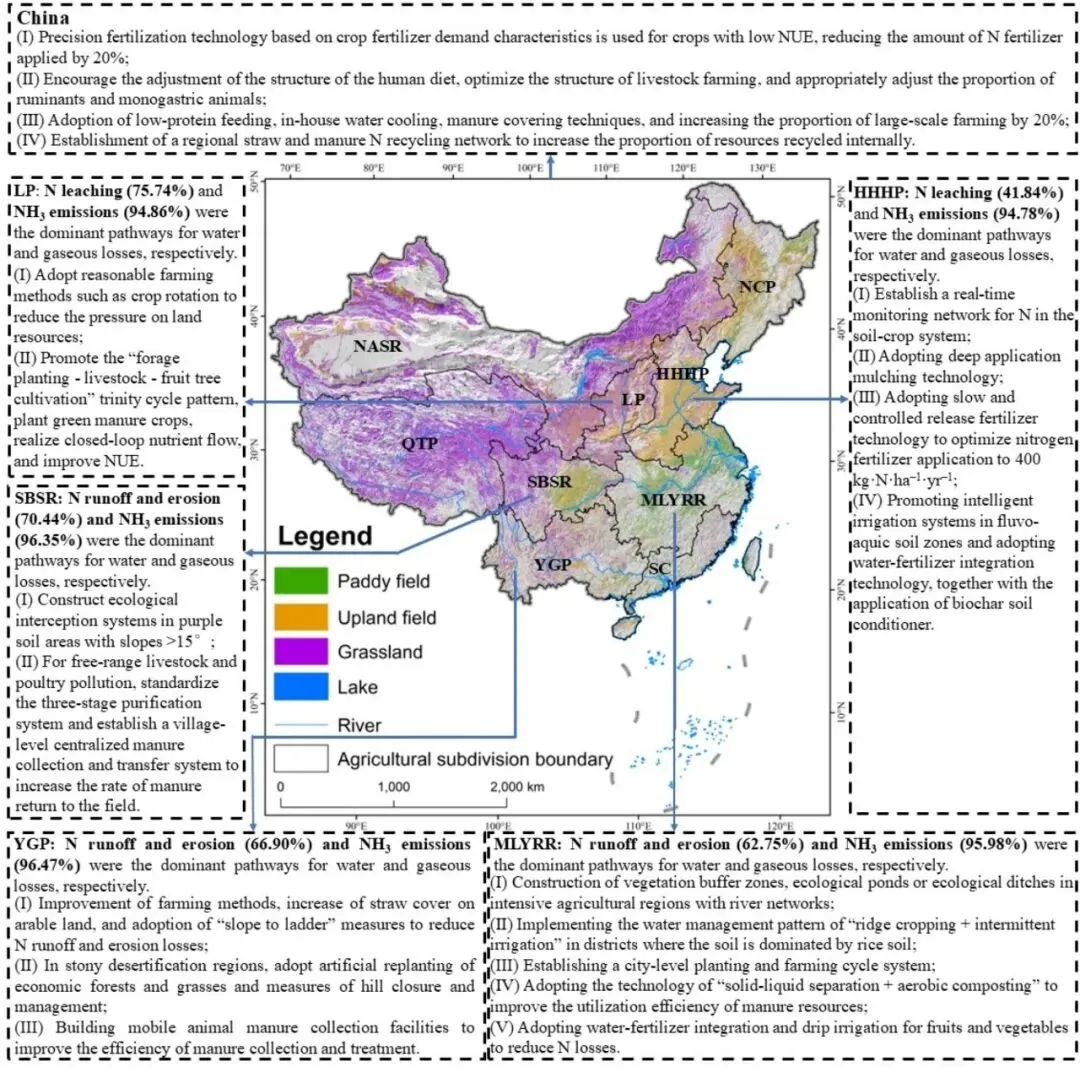
图 13.中国区域氮管理策略。
Fig. 13.Regional N differentiation management strategies in China.
总结 | Conclusions
在本研究中,我们通过创新型引入人粪尿指标和畜牧业本地化参数,改进了NUFER模型,构建了中国高分辨率市域尺度的氮流数据库,并系统评估了:(1)氮流特征,(2)氮利用效率时空格局,(3)氮流失热点区域,(4)消减潜力,以及(5)区域氮管理优化路径。分析表明,自2000年以来,中国农田系统与畜牧系统的氮利用效率分别提高了39.91%和46.30%,且呈现明显的空间异质性。其中,农田系统氮利用效率的高值区主要分布于东北平原和黄淮海平原区,而畜牧系统氮利用效率的低值区则主要集中于中国西部及云贵高原区。此外,水果和蔬菜的氮利用效率远低于其他作物。玉米、蔬菜、水稻、水果和小麦贡献了作物氮流失总量的82.29%,而肉牛、生猪和蛋禽则占畜牧氮流失的83.52%。其中,经济作物和反刍动物的氮流失强度较高。情景分析S3表明,实施综合措施——包括优化施肥、加强农业资源循环利用、调整畜牧结构及改进粪便管理——可使氮肥使用量减少22.64%,并将总氮流失降低31.38%(5.03 Tg)。这为城市制定有效的农业面源污染控制指引提供了可行路径。
本研究构建了一个从城市尺度出发的综合性氮流评估框架,评估结果不仅可为区域农业绿色转型提供精细化管理决策支持,同时填补了省县之间的尺度断层,也为全球其他国家农业系统实施区域差异化的氮管理策略提供了重要科学依据。

Agricultural Systems
点击公众号最底部“阅读原文”
查看原文
引用:Wu, Z., Liang, H., Liu, Z., Du, H., He, L., Xie, Z., Zhu, J., Zheng, B., & Wan, W. (2026). Nitrogen dilemma in Chinese crop-livestock systems: Assessing mitigation potential and exploring optimization pathways from the perspectives of utilization efficiency and pollution hotspots. Agricultural Systems, 233, 104642.
通讯作者
Bofu Zheng | School of Infrastructure Engineering, Nanchang University, Nanchang 330031, China
Email | zhengbf@ncu.edu.cn
Wei Wan | Engineering Research Center of Watershed Carbon Neutralization, Nanchang University, Nanchang 330031, China
Email | wanwei@ncu.edu.cn
公众号简介

扫二维码 | 关注期刊官微
SCI期刊Agricultural Systems (AS), Agriculture, Ecosystems & Environment (AGEE), Agricultural and Forest Meteorology (AFM), Agricultural Water Management (AWM) 服务平台,Social Media Specialists 负责运营,推广最新科研成果,加强同行交流合作,保障全球粮食安全,促进农业生产可持续性发展。
AS期刊官网:
https://www.sciencedirect.com/journal/agricultural-systems
AGEE期刊官网:
https://www.sciencedirect.com/journal/agriculture-ecosystems-and-environment
AFM期刊官网:
https://www.sciencedirect.com/journal/agricultural-and-forest-meteorology
AWM期刊官网:
https://www.sciencedirect.com/journal/agricultural-water-management
相关期刊
 AS |  AGEE |  AFM |  AWM |
声明
欢迎转载、转发本号原创内容,转载信息请与本号联系授权,标注信息来源为《Agricultural System 粮食安全》。转载、合作联系
Social Media Specialists:E-mail:hanjichong@mail.bnu.edu.cn。本号转载信息旨在传播交流,中文翻译仅供参考,准确内容请阅读英文原文。

